> ## Documentation Index
> Fetch the complete documentation index at: https://help.pixwel.com/llms.txt
> Use this file to discover all available pages before exploring further.
# Reports
> The reports available in Pixwel, what each one shows, and who can see them.
**Reports** turn the platform's activity into data you can review and export — orders placed, money spent, files downloaded, feedback collected, and more.
 ## Available reports
| Report | What it shows |
| -------------------------- | ----------------------------------------------------------------------------------------------------------- |
| **Orders** | Individual [work requests](/features/work-requests) with their asset, studio, project, status, and history. |
| **Order Volume** | Order counts aggregated by asset, project, or studio. Drill in to the underlying orders. |
| **Offline Rejection** | Work that was rejected, with the asset and rejection details. |
| **Encodes** | Encoding jobs, with file names, presets, size, duration, and status. |
| **Group Spending Summary** | Total spend per group — useful for tracking budgets. |
| **Group Exceptions** | Groups that have crossed spending or other thresholds. |
| **Downloads** | Every file [download](/features/downloads), with the user, group, project, asset, and timestamp. |
| **Feedback** | Votes, comments, and "would order" responses from [shares](/features/shares), by asset and aspect ratio. |
| **Feedback Stats** | Feedback rolled up across shared assets. |
## Analytics and AI Insights
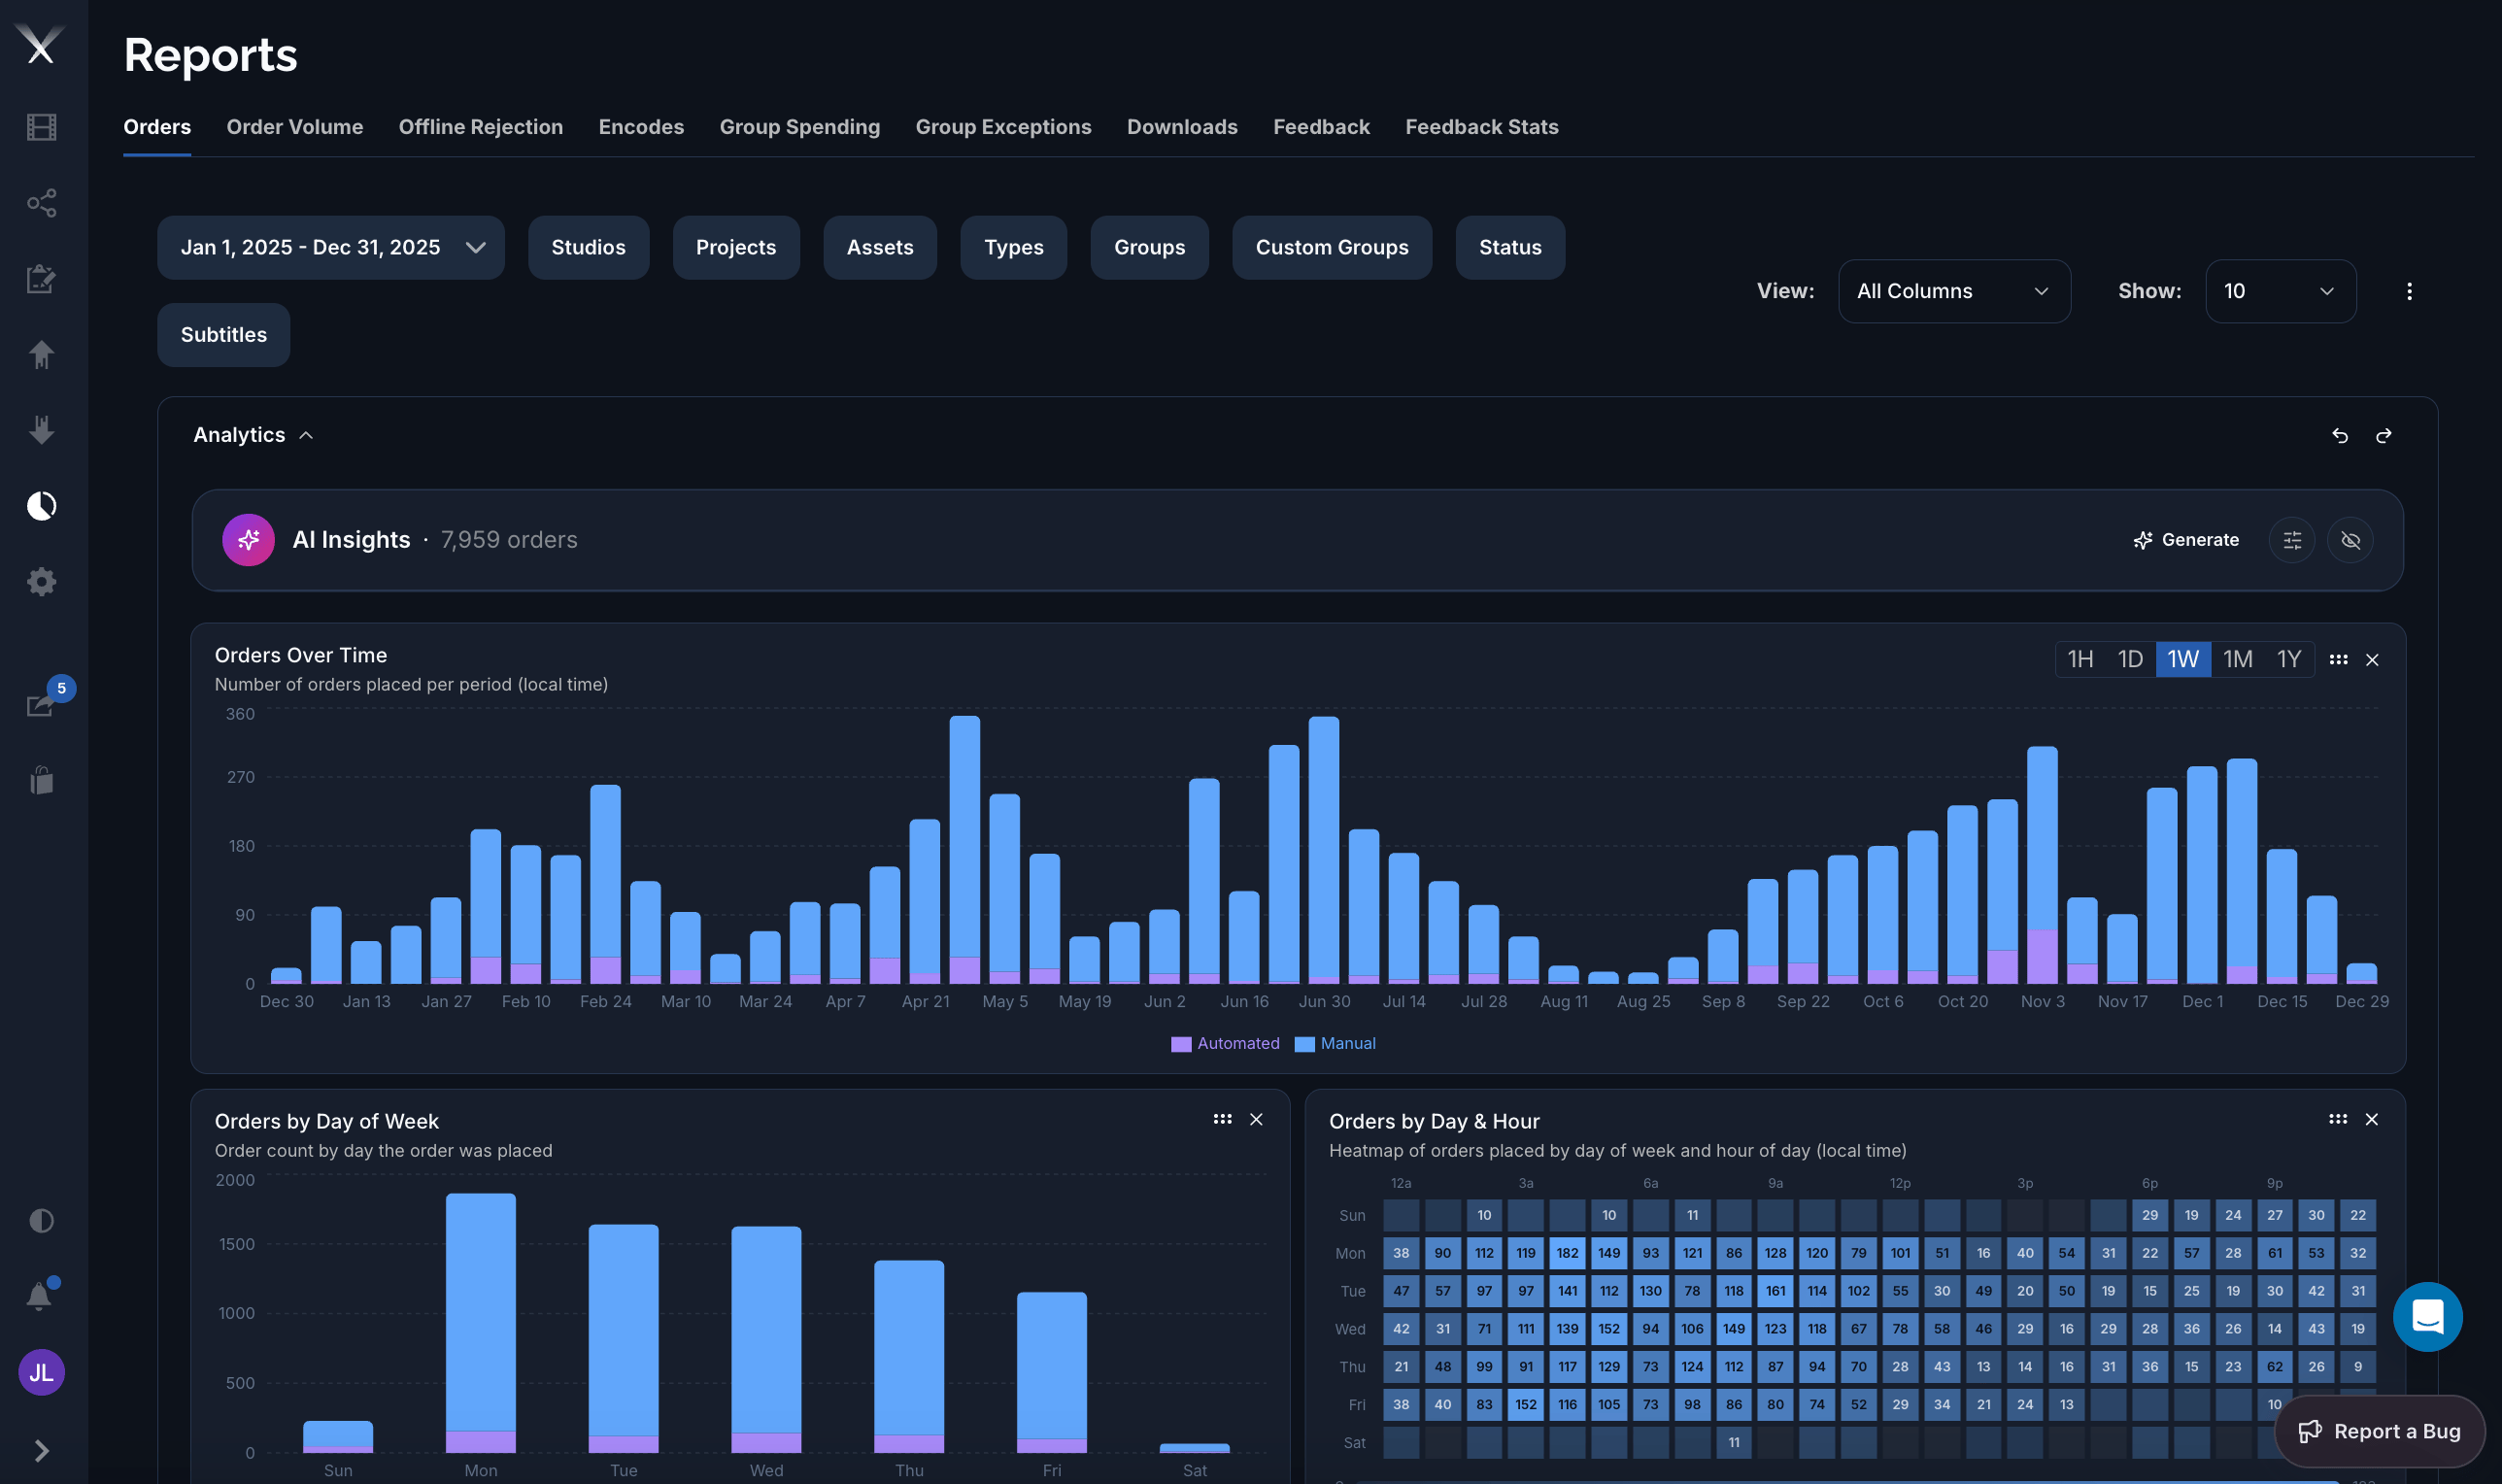
Above the results table, a report can show an **Analytics** panel — a set of charts visualizing the filtered data. On the Orders report these include **Orders Over Time** (orders per period, split into automated and manual), **Orders by Day of Week**, and an **Orders by Day & Hour** heatmap. The charts follow whatever filters and date range you've set, and time buckets can be switched (1H / 1D / 1W / 1M / 1Y).
**AI Insights** sits at the top of the Analytics panel. Press **Generate** and Pixwel produces a written, plain-language analysis of the report — a few ranked, actionable findings drawn from the data on screen. For how it works, what it can see, and how to tailor it, see [AI Insights](/features/ai-insights).
## Who can see them
Reports are permission-controlled. **Administrators** can see all reports; everyone else sees only the reports their group has been granted (for example work request, download, or feedback reporting). See [User roles](/features/user-roles) for how those permissions work.
## Working with a report
Once you're in a report you can:
* **Filter** by project, studio, asset type, date range, group, and other fields
* **Sort** by clicking column headers, and **page** through results
* **Customize columns** and save view presets
* **Export** the filtered results as **CSV** or **PDF**
## Available reports
| Report | What it shows |
| -------------------------- | ----------------------------------------------------------------------------------------------------------- |
| **Orders** | Individual [work requests](/features/work-requests) with their asset, studio, project, status, and history. |
| **Order Volume** | Order counts aggregated by asset, project, or studio. Drill in to the underlying orders. |
| **Offline Rejection** | Work that was rejected, with the asset and rejection details. |
| **Encodes** | Encoding jobs, with file names, presets, size, duration, and status. |
| **Group Spending Summary** | Total spend per group — useful for tracking budgets. |
| **Group Exceptions** | Groups that have crossed spending or other thresholds. |
| **Downloads** | Every file [download](/features/downloads), with the user, group, project, asset, and timestamp. |
| **Feedback** | Votes, comments, and "would order" responses from [shares](/features/shares), by asset and aspect ratio. |
| **Feedback Stats** | Feedback rolled up across shared assets. |
## Analytics and AI Insights
Above the results table, a report can show an **Analytics** panel — a set of charts visualizing the filtered data. On the Orders report these include **Orders Over Time** (orders per period, split into automated and manual), **Orders by Day of Week**, and an **Orders by Day & Hour** heatmap. The charts follow whatever filters and date range you've set, and time buckets can be switched (1H / 1D / 1W / 1M / 1Y).
**AI Insights** sits at the top of the Analytics panel. Press **Generate** and Pixwel produces a written, plain-language analysis of the report — a few ranked, actionable findings drawn from the data on screen. For how it works, what it can see, and how to tailor it, see [AI Insights](/features/ai-insights).
## Who can see them
Reports are permission-controlled. **Administrators** can see all reports; everyone else sees only the reports their group has been granted (for example work request, download, or feedback reporting). See [User roles](/features/user-roles) for how those permissions work.
## Working with a report
Once you're in a report you can:
* **Filter** by project, studio, asset type, date range, group, and other fields
* **Sort** by clicking column headers, and **page** through results
* **Customize columns** and save view presets
* **Export** the filtered results as **CSV** or **PDF**