

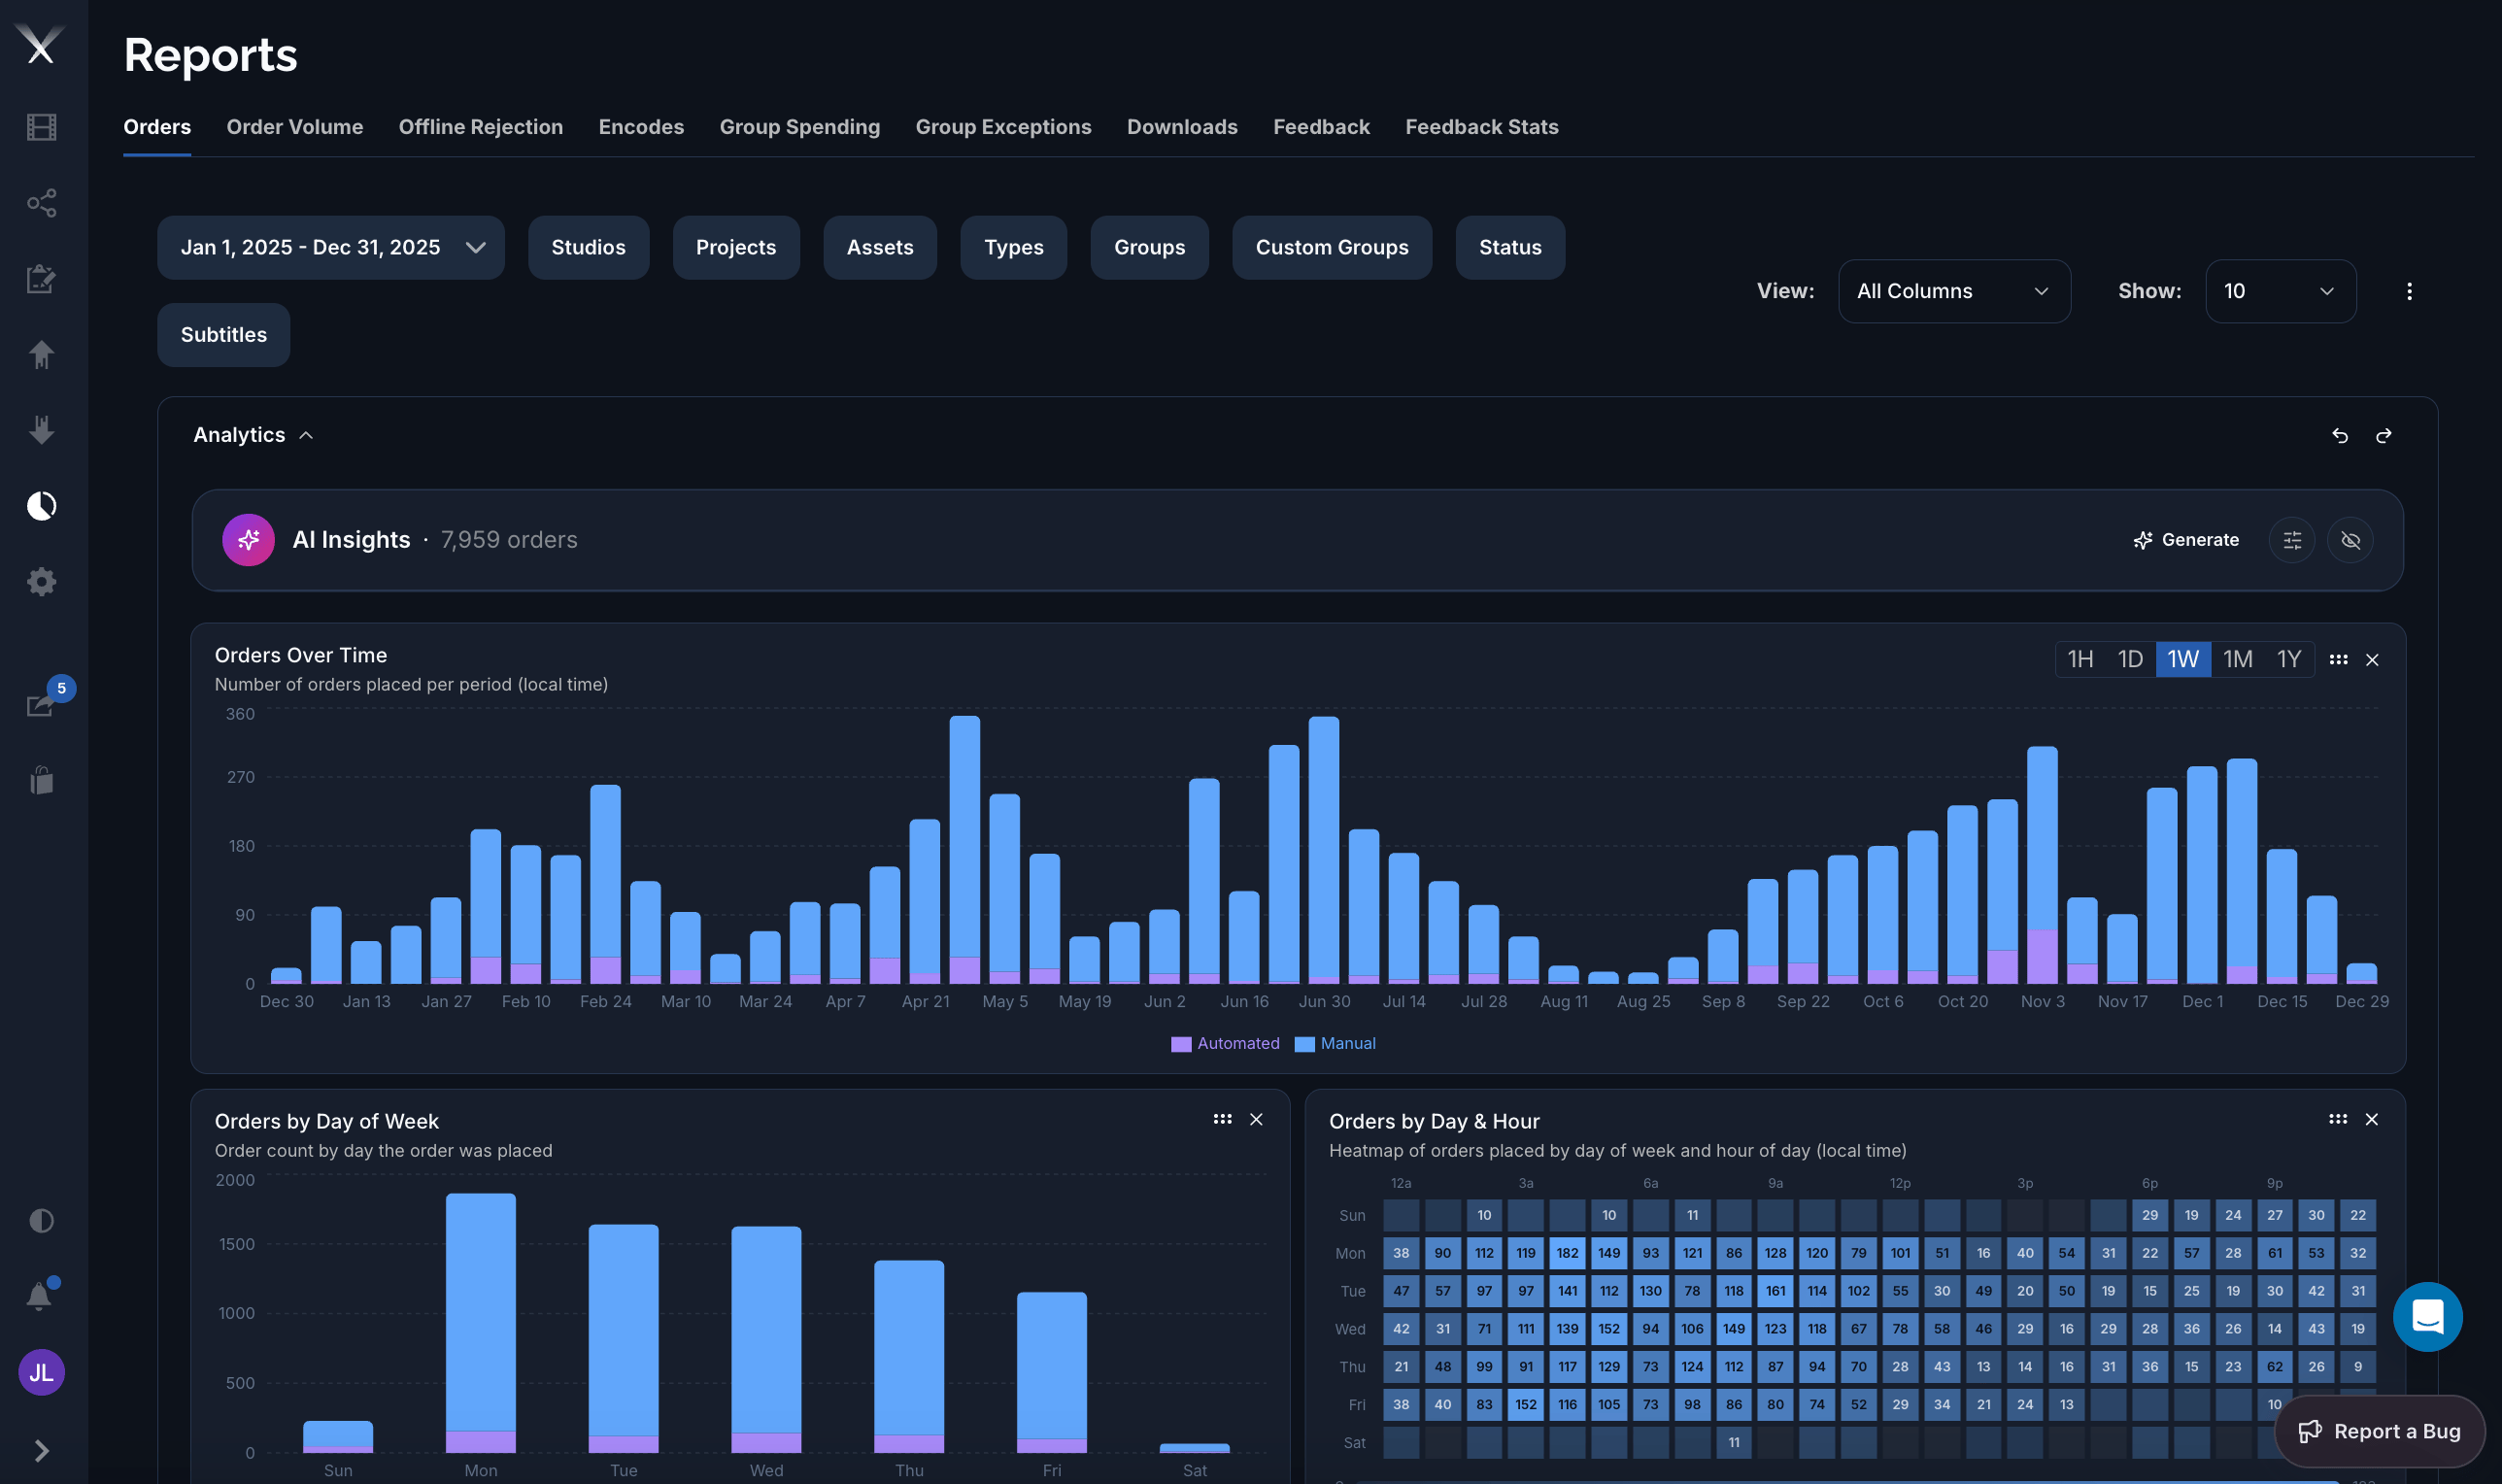
The Orders report: filter across the top, an Analytics panel with charts (Orders Over Time, by day of week, day & hour heatmap), and AI Insights summarizing the data.
Available reports
Analytics and AI Insights
Above the results table, a report can show an Analytics panel — a set of charts visualizing the filtered data. On the Orders report these include Orders Over Time (orders per period, split into automated and manual), Orders by Day of Week, and an Orders by Day & Hour heatmap. The charts follow whatever filters and date range you’ve set, and time buckets can be switched (1H / 1D / 1W / 1M / 1Y). AI Insights sits at the top of the Analytics panel. Press Generate and Pixwel produces a written, plain-language analysis of the report — a few ranked, actionable findings drawn from the data on screen. For how it works, what it can see, and how to tailor it, see AI Insights.Who can see them
Reports are permission-controlled. Administrators can see all reports; everyone else sees only the reports their group has been granted (for example work request, download, or feedback reporting). See User roles for how those permissions work.Working with a report
Once you’re in a report you can:- Filter by project, studio, asset type, date range, group, and other fields
- Sort by clicking column headers, and page through results
- Customize columns and save view presets
- Export the filtered results as CSV or PDF