Reports turn platform activity into data you can filter and export. This guide covers running them. Reports are permission-controlled — see who can see them.

Running a report

1

Open Reports

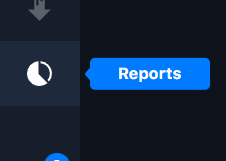
Click the pie-chart icon in the left navigation bar.
2

Pick a report type

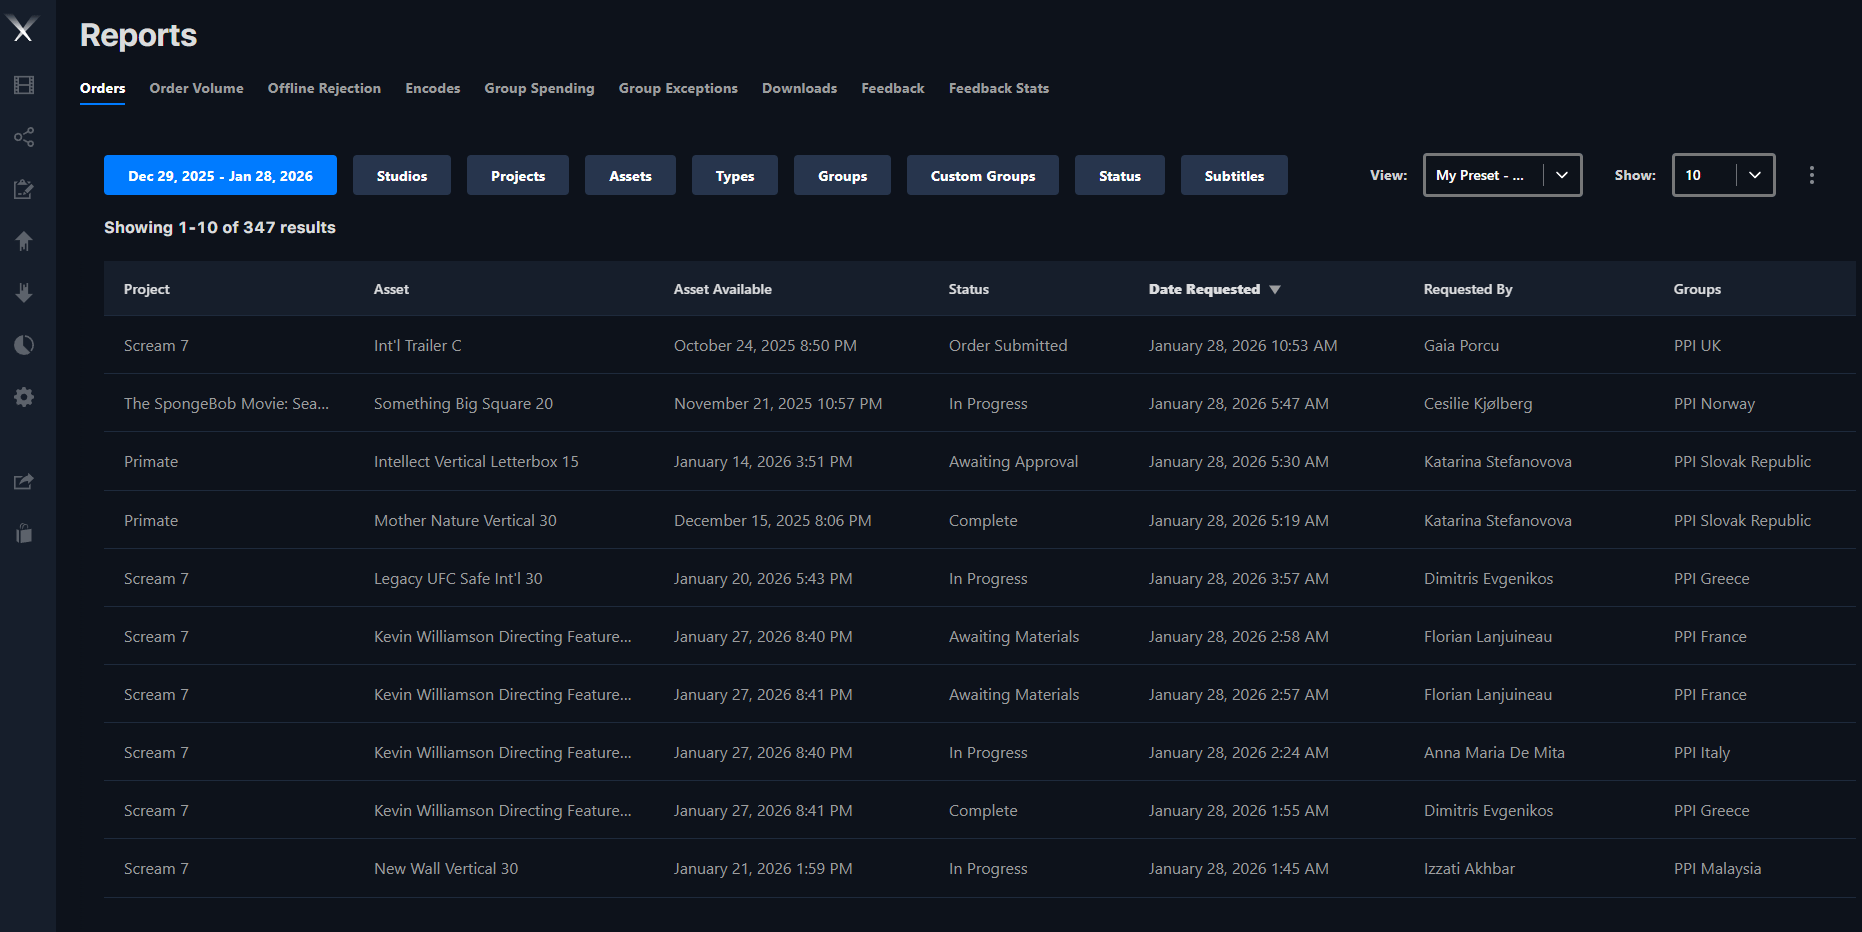
Choose a report from the tabs across the top (Orders, Downloads, Encodes, and so on).
3

Filter

Narrow the data with the available filters — Date, Studios, Projects, Types, Groups, Users, Filetype, Status, Subtitles. The filters offered depend on the report type.
4

Set the date range

Reports default to the past 30 days. Use the year/month/day pickers for a custom range.
5

Export

Open the vertical ellipsis () menu and export as .csv or .pdf.
The Reports area

Open Reports from the pie-chart icon in the left navigation bar.

Report type tabs

Choose a report type from the tabs across the top.

Report filters

Narrow the data with the available filters.

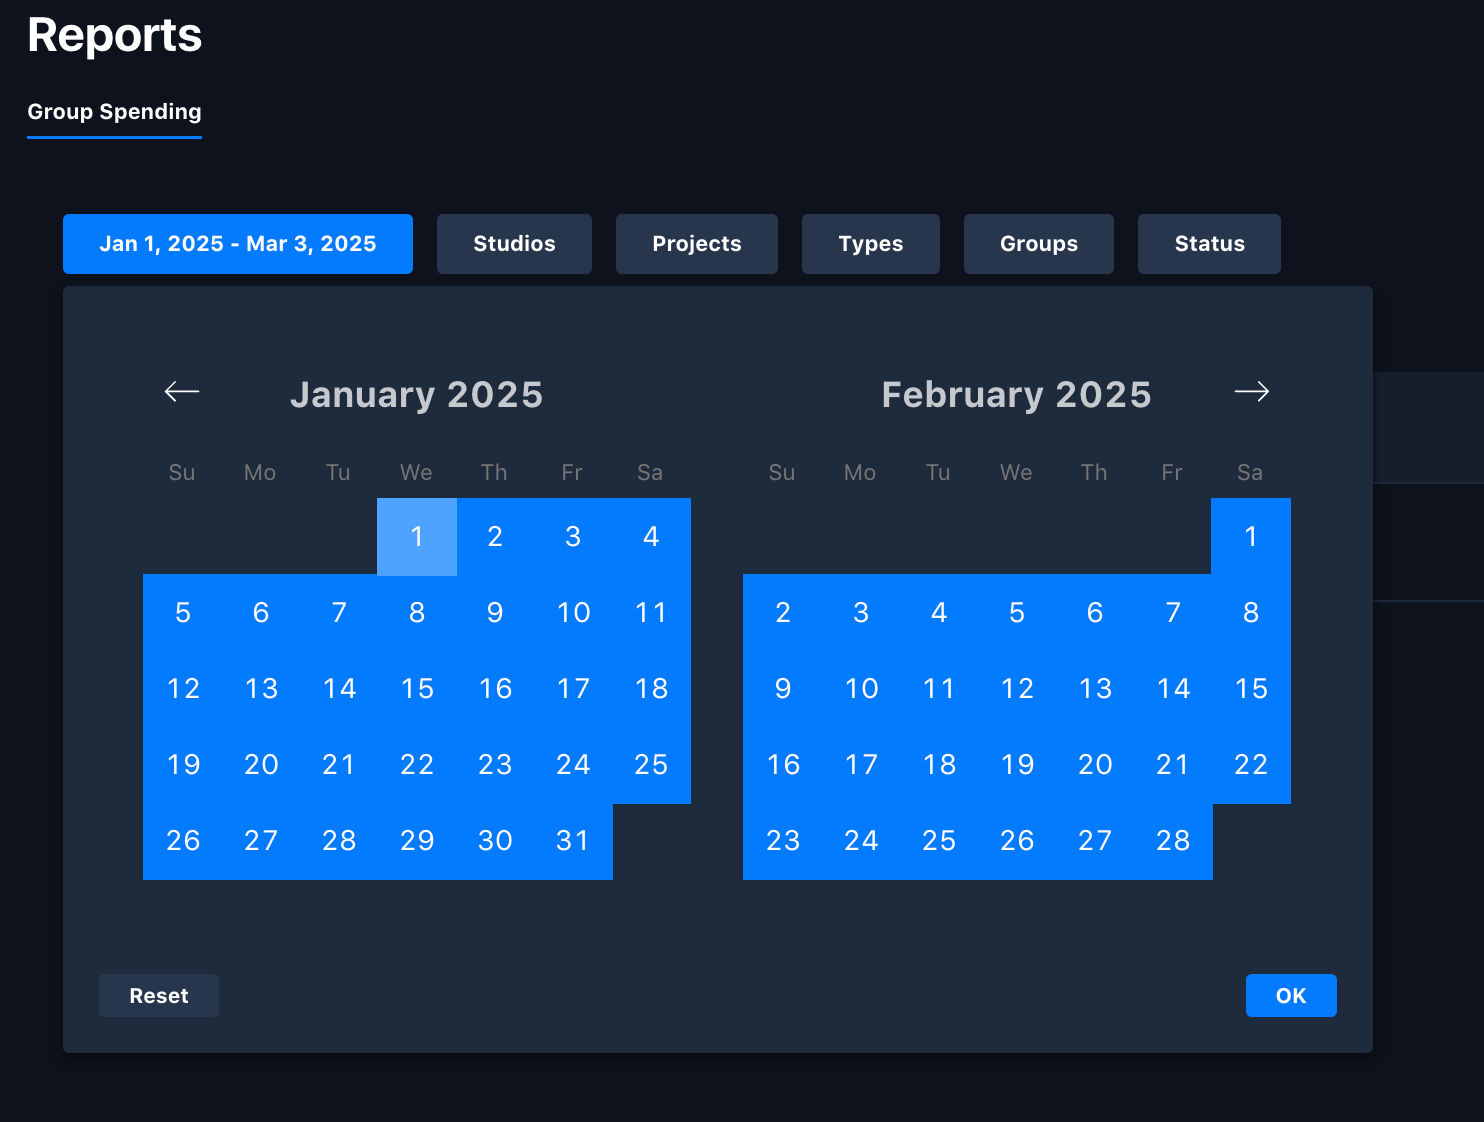
The report date-range picker

Set a custom date range with the year, month, and day pickers.

A report updating as filters change

Results update automatically as you change selections.
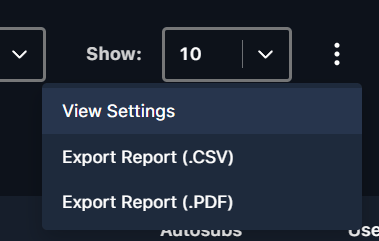
The export menu for a report

Export the report as CSV or PDF from the ⋮ menu.
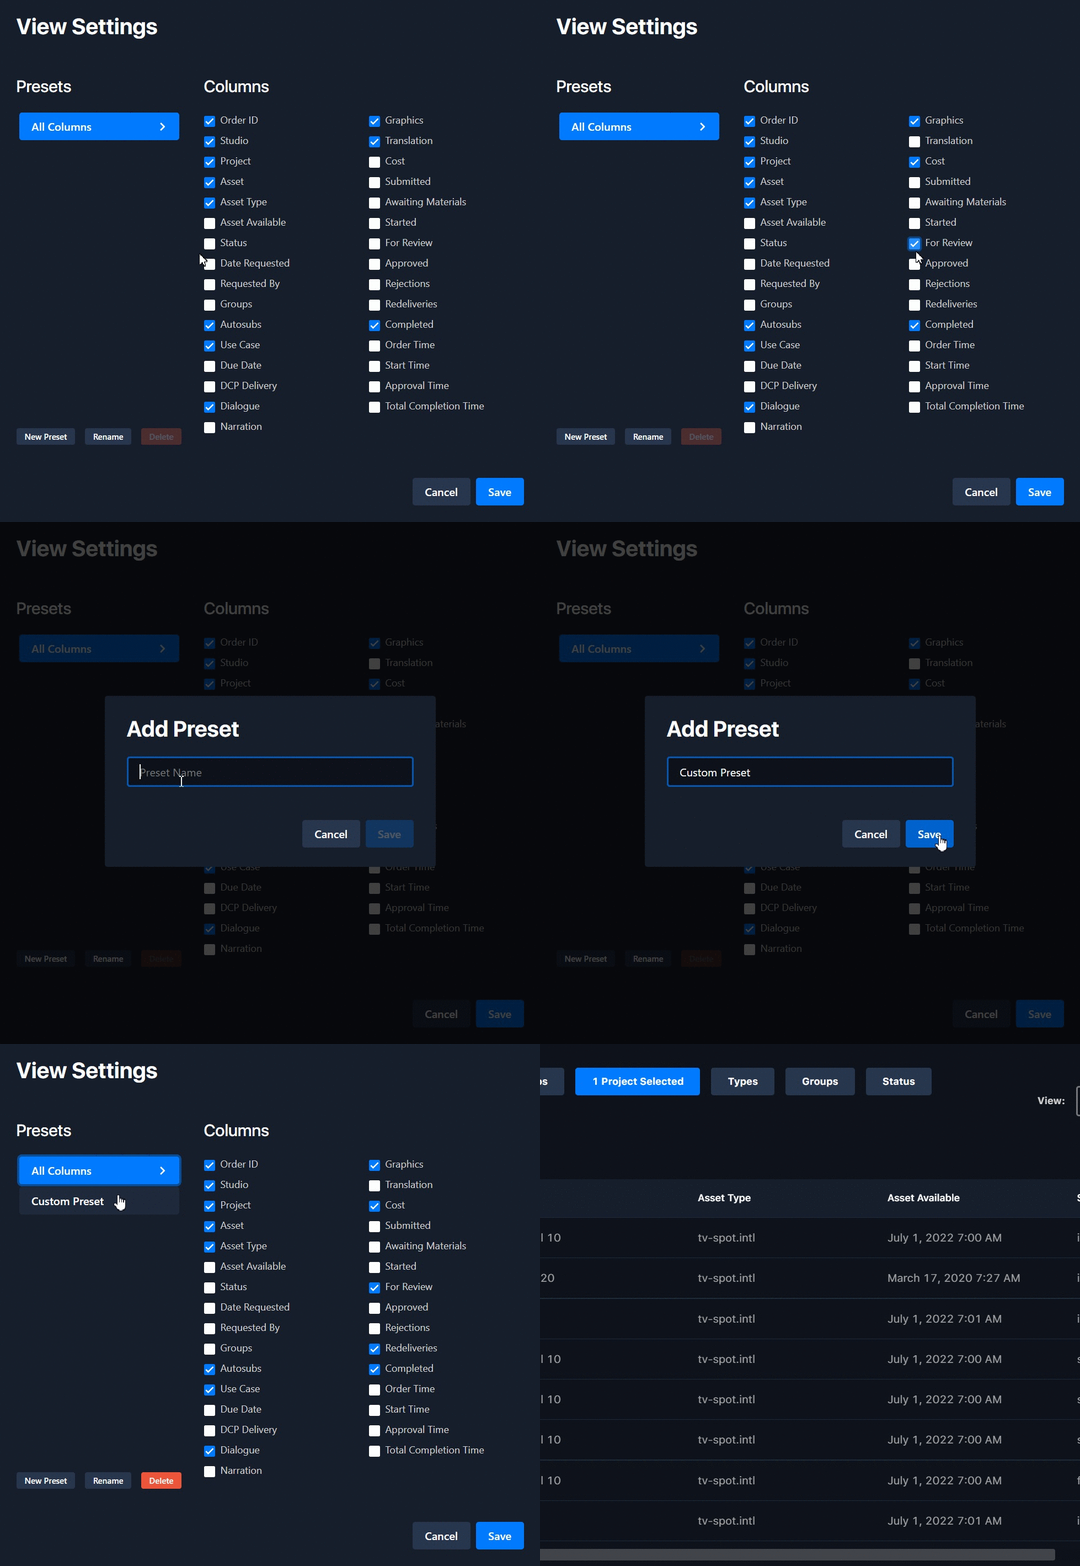
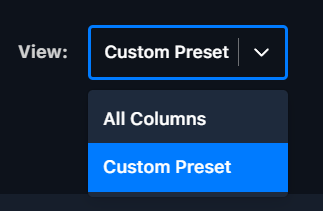
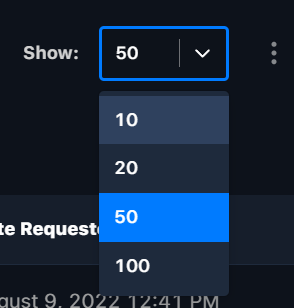
Results update automatically as you change selections. Use ⋮ → View Settings to choose visible columns, save named presets (rename/delete them from the bottom-left), pick a preset from the View dropdown, and set rows per page with Show.
Choosing visible columns in View Settings

View Settings: choose which columns are visible.
Saving a column preset

Save a named column preset to reuse later.
The View dropdown listing saved presets

Pick a saved preset from the View dropdown.
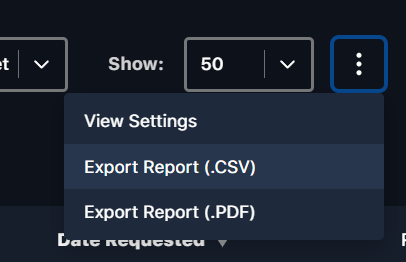
The rows-per-page control

Set how many rows show per page with Show.

Custom column views are specific to a report type — a preset saved on one report can’t be used on another.

Group Spending report

The Group Spending report tracks spend per group.
  • Date range defaults to one full month ending today — adjust the calendar as needed.
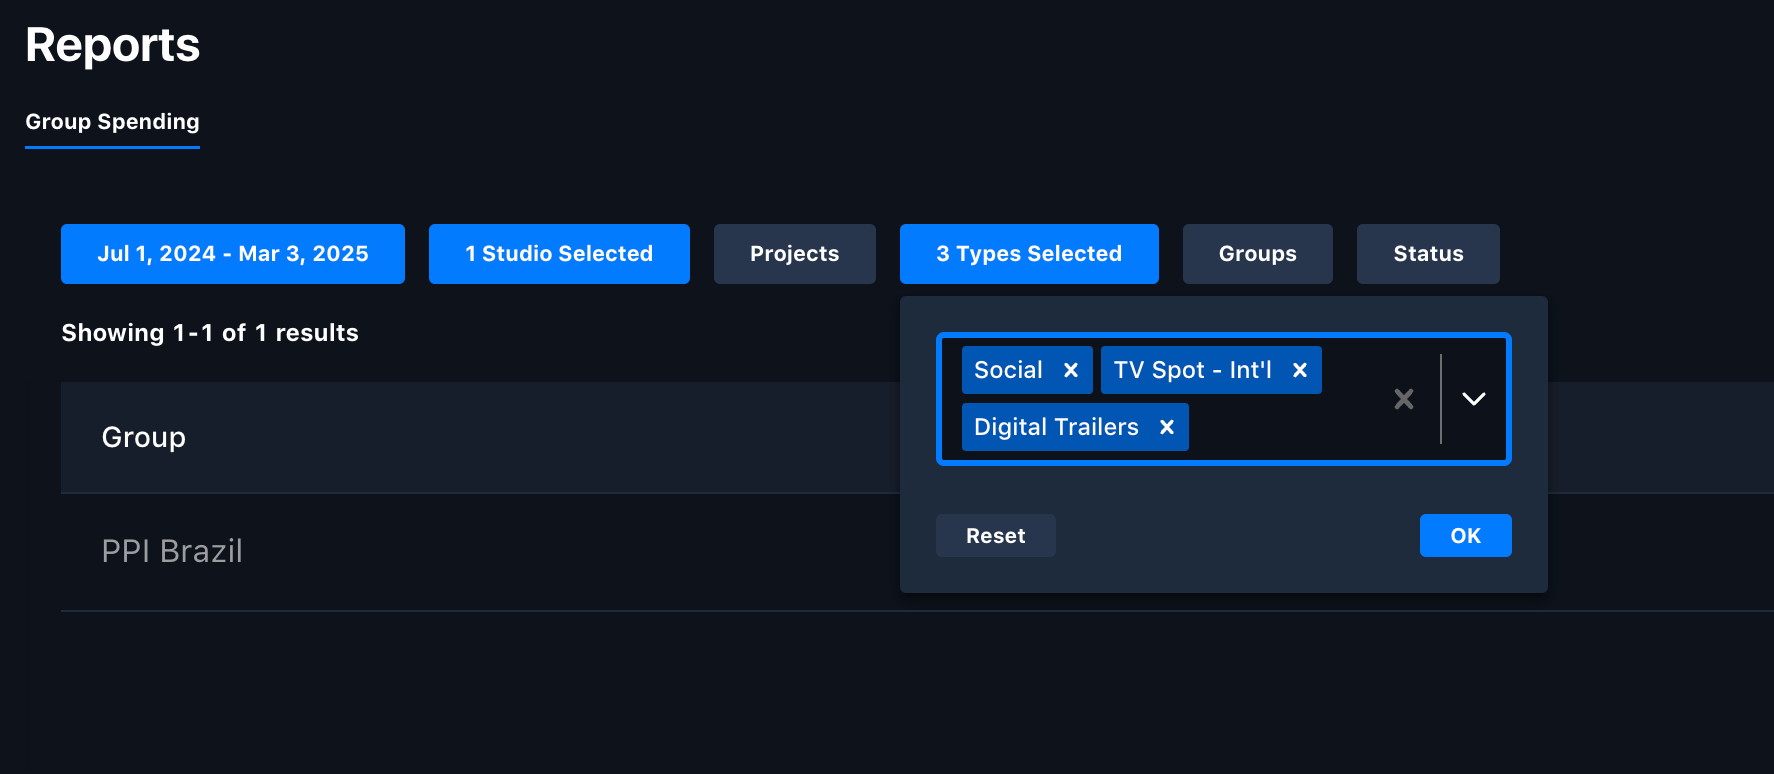
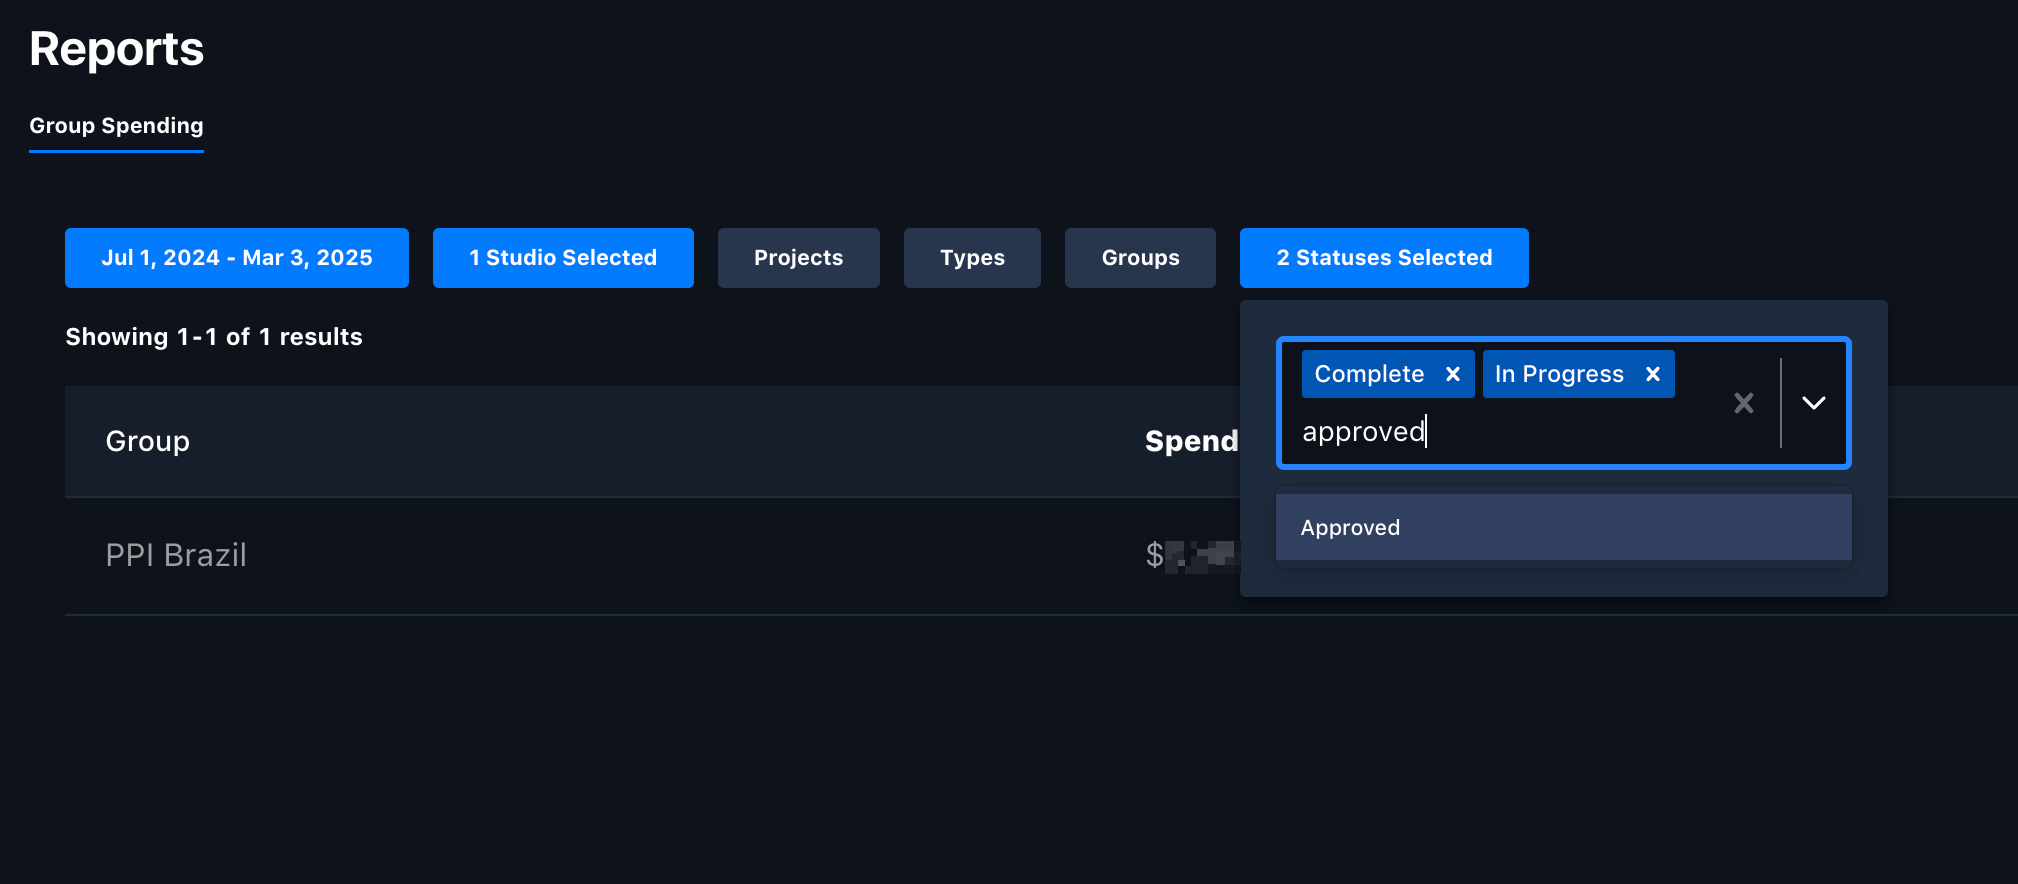
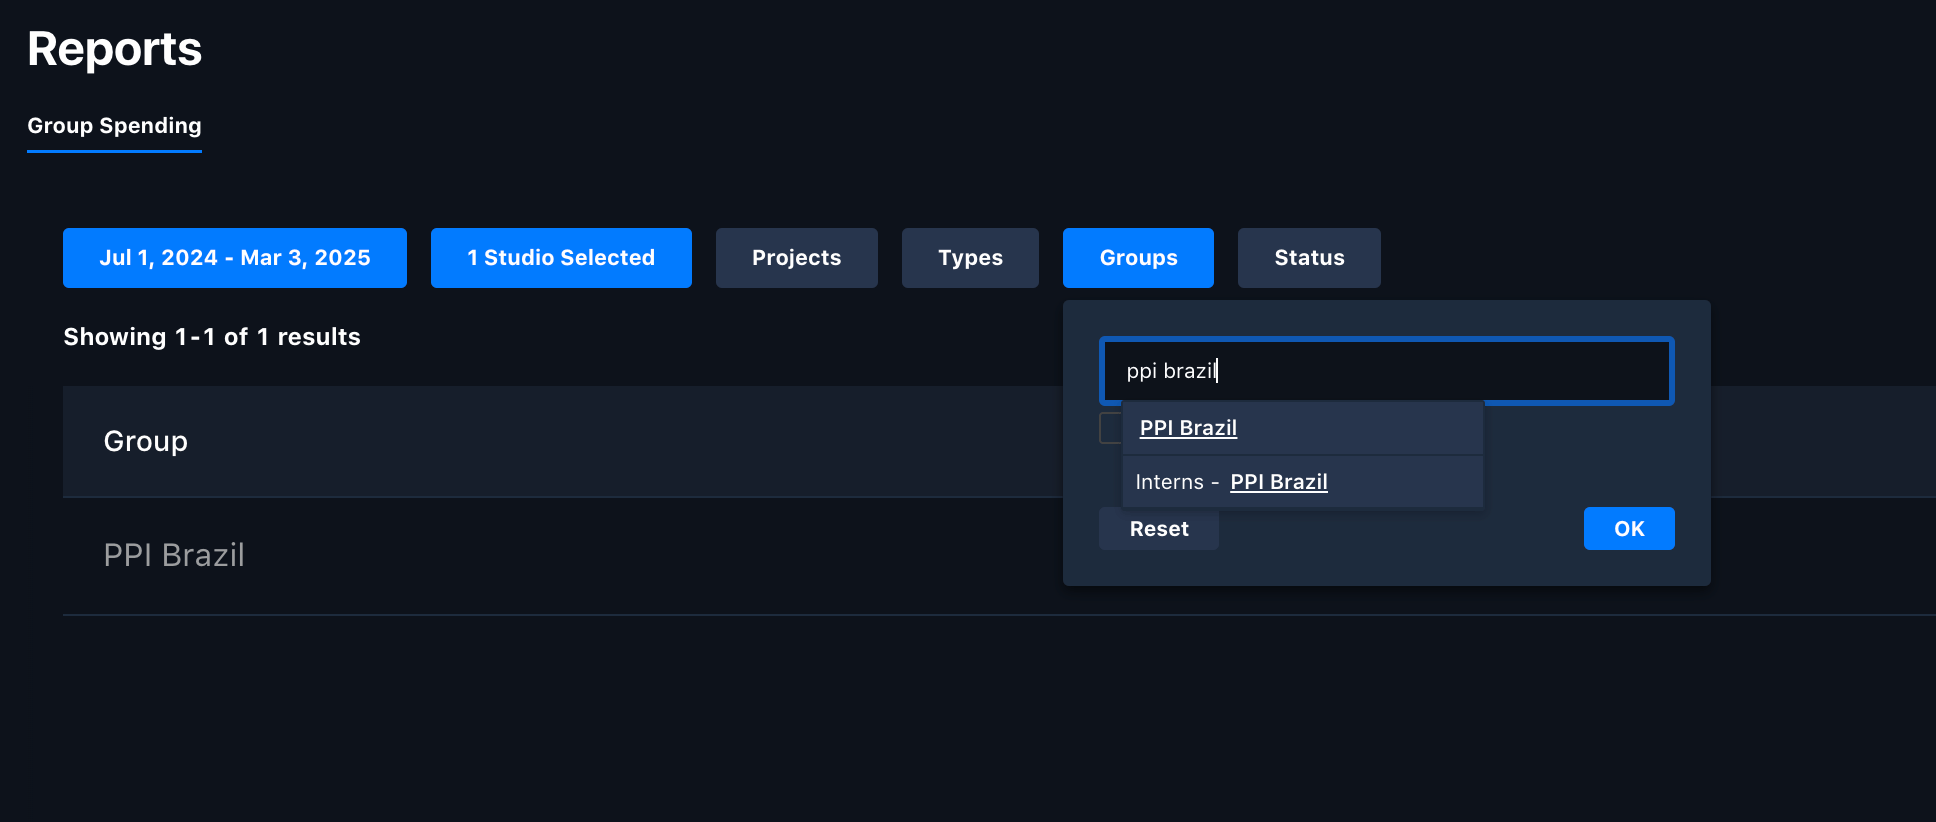
  • Filter by Studio, Project, Asset Type, and Work Request Status, and by group if you have access to more than one.
  • Export from the menu as .CSV or .PDF.
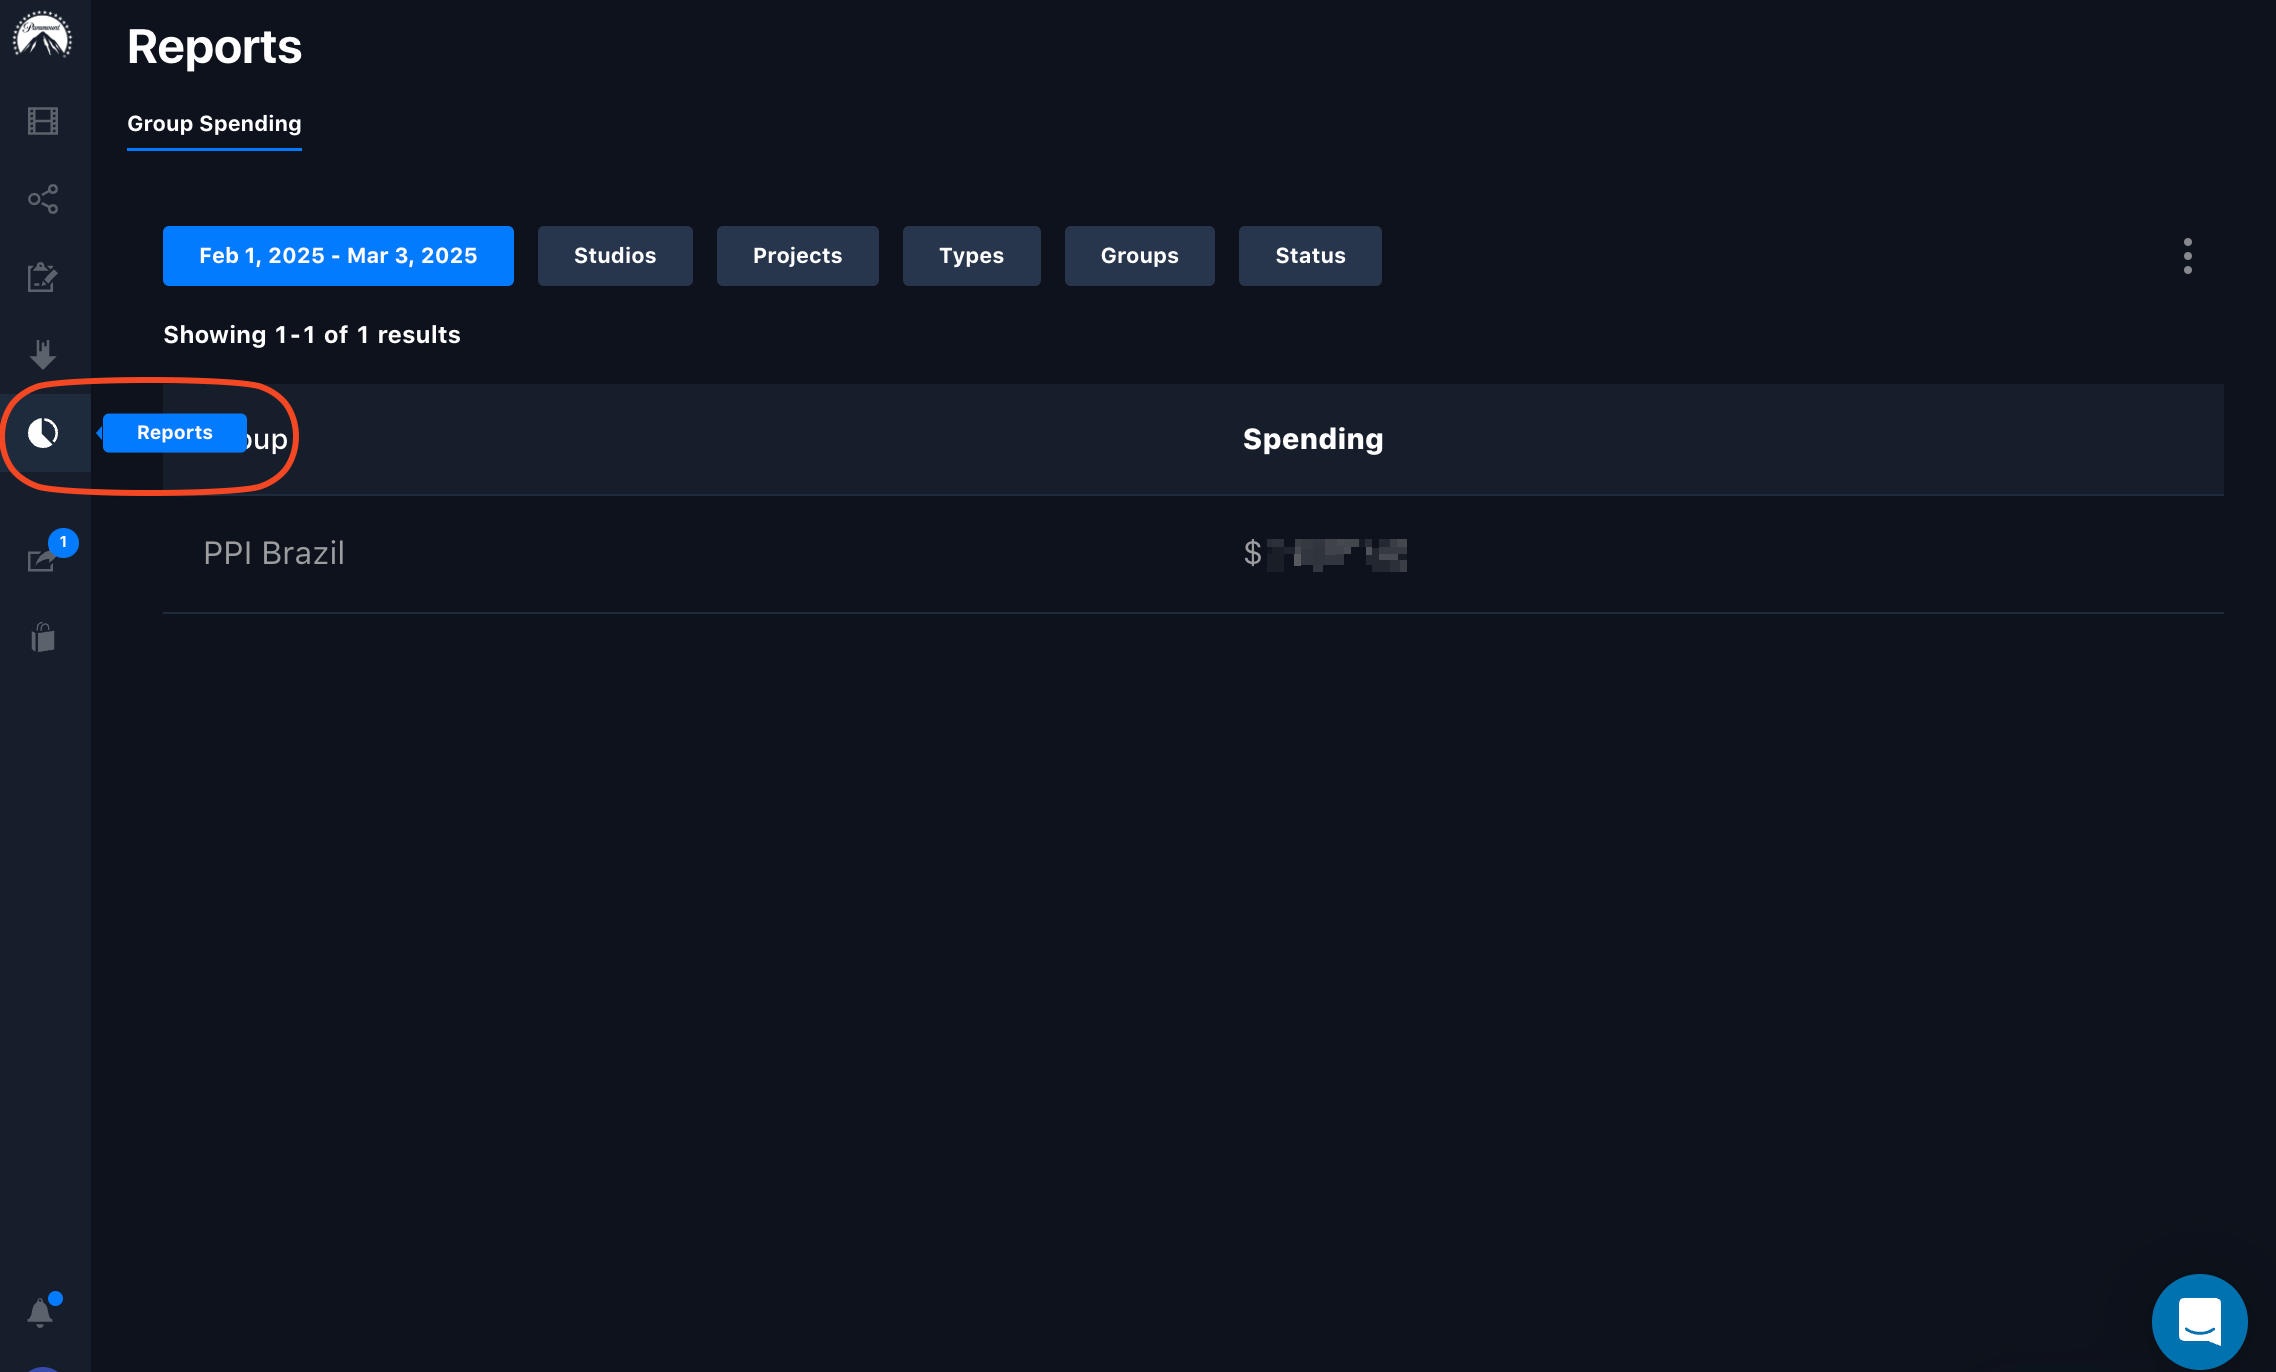
The Group Spending report

Opening the Group Spending report.

The Group Spending date range

The date range defaults to one full month ending today.
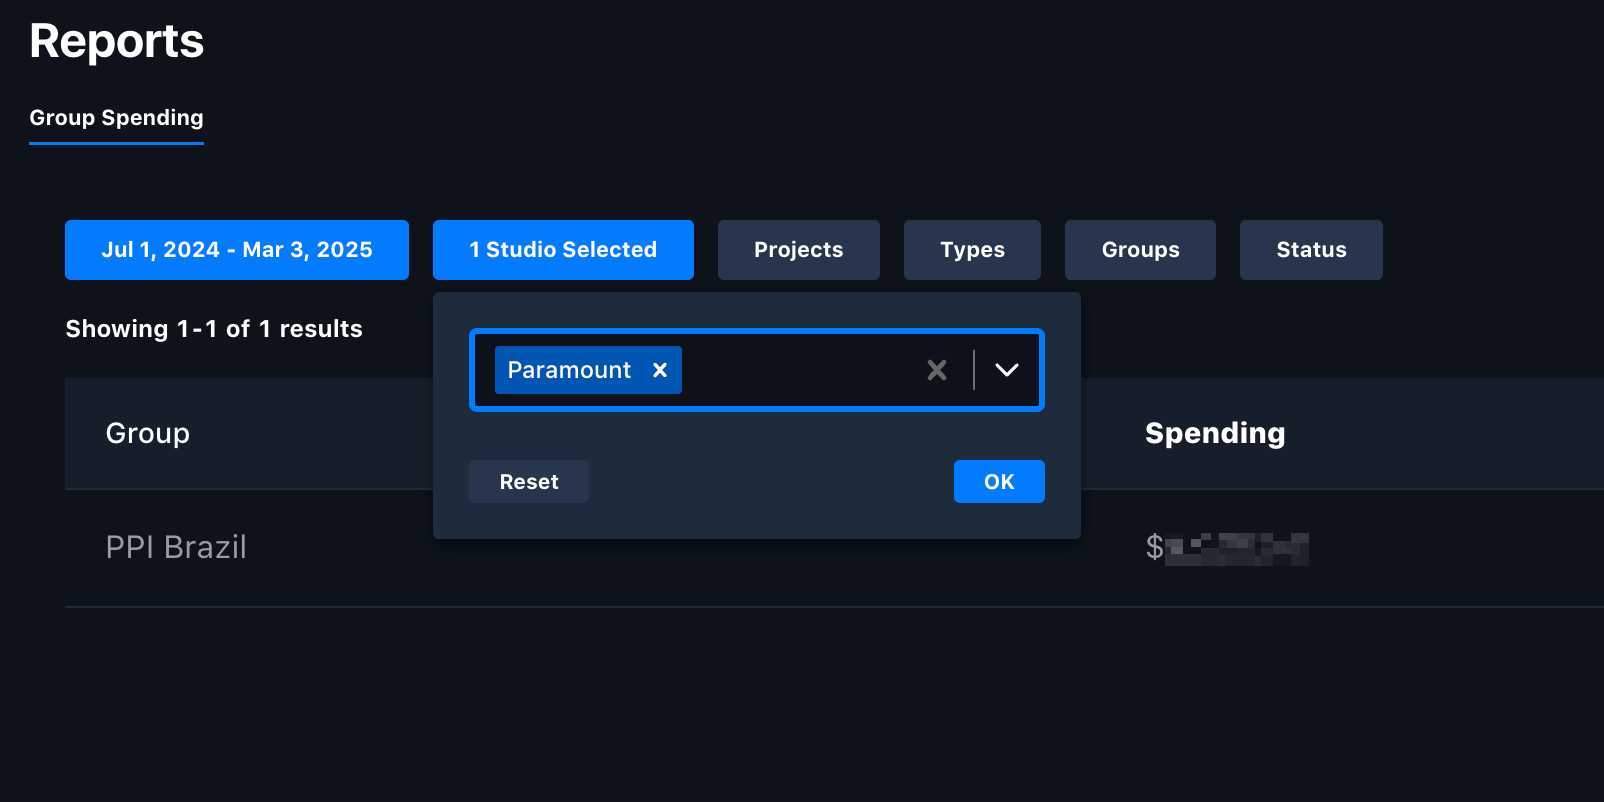
Filtering Group Spending by studio

Filter by studio.

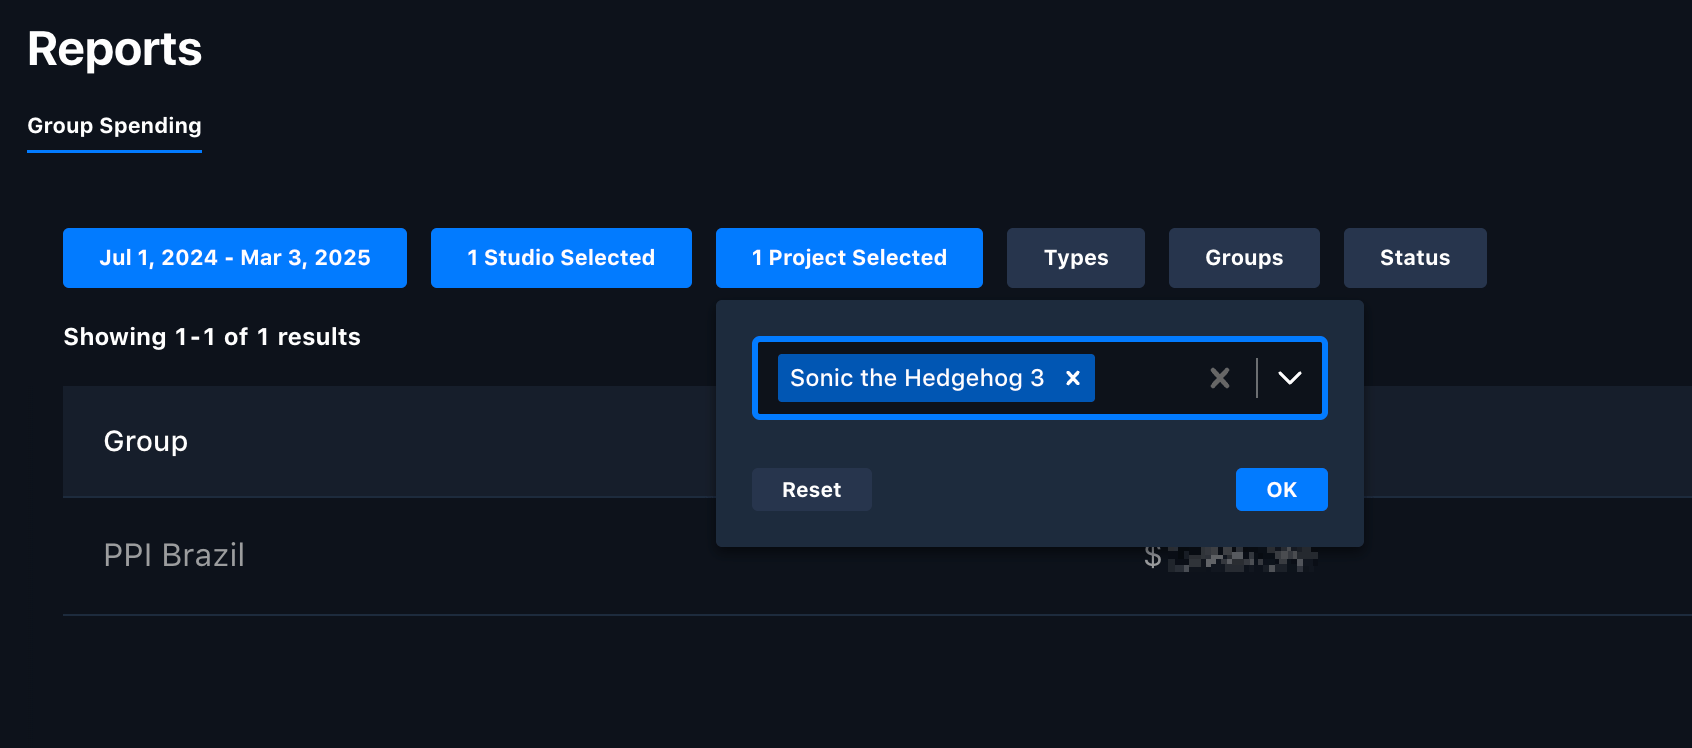
Filtering Group Spending by project

Filter by project.

Filtering Group Spending by asset type

Filter by asset type.

Filtering Group Spending by work request status

Filter by work request status.

Switching groups in the Group Spending report

Switch between groups you have access to.
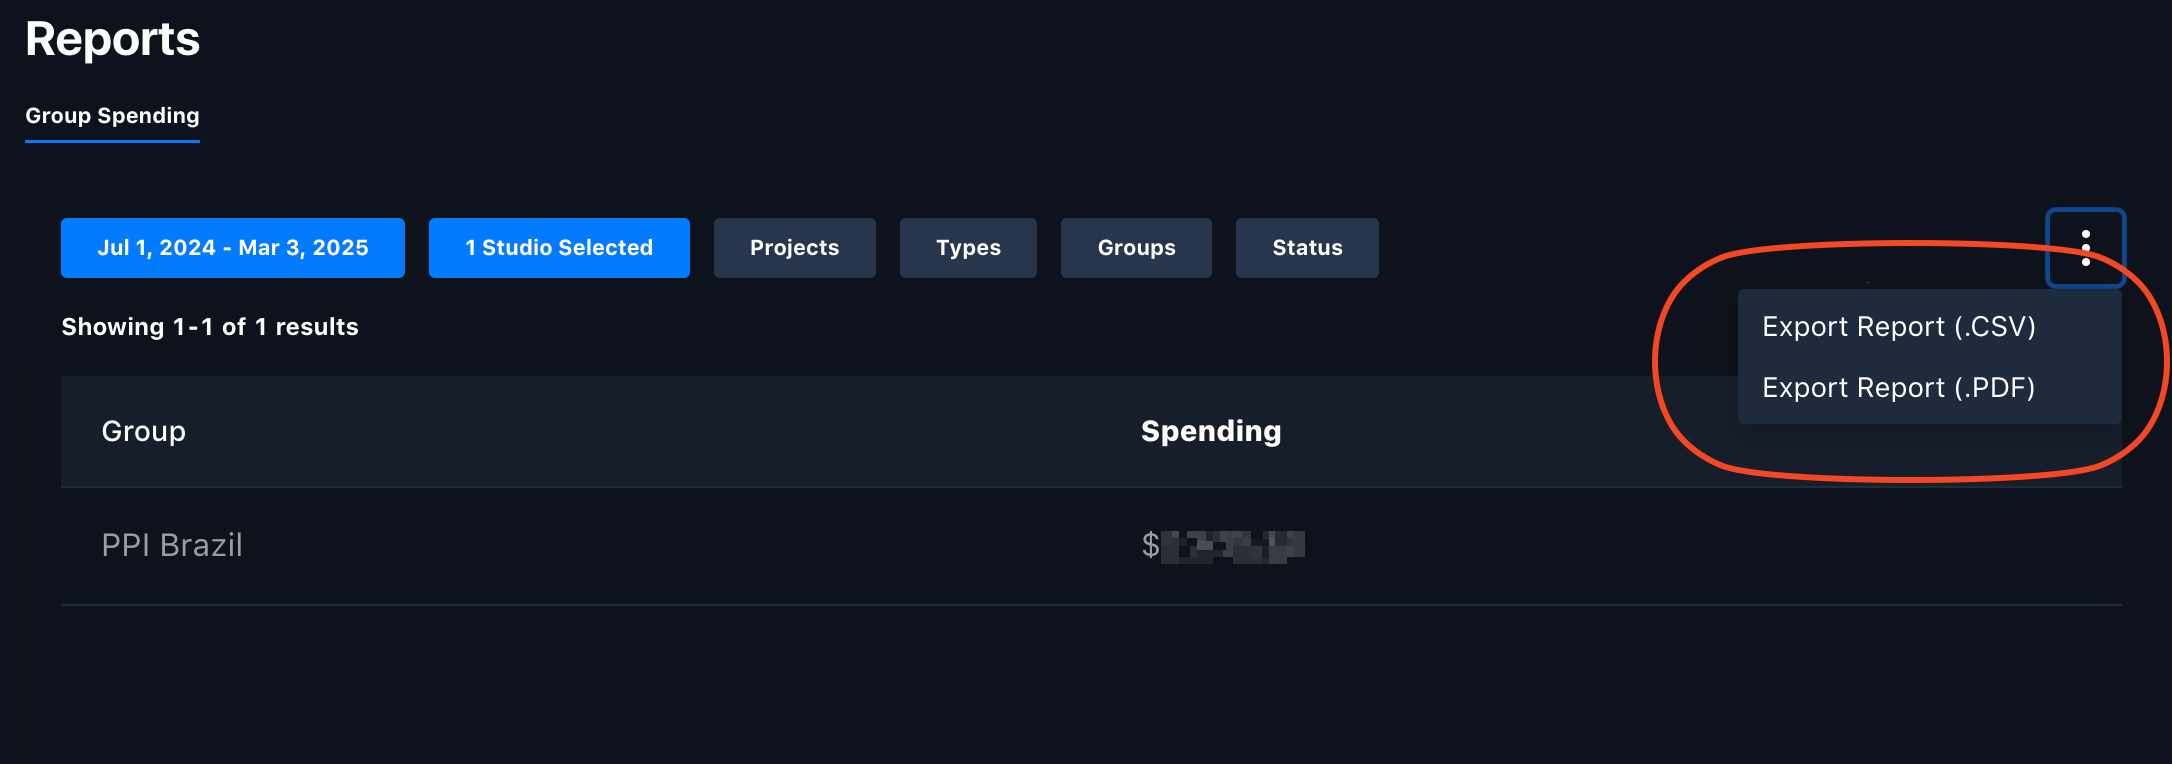
Exporting the Group Spending report

Export the spend-per-group results as CSV or PDF.

Two studio filters are easy to confuse: Paramount covers the major projects released worldwide, while Paramount-Limited covers projects released only in specific territories.